


A high churn rate is more than just a revenue problem. Losing customers hurts your business’ reputation, visibility, and potential for growth. And since you may never find out why most of them left, you might not know what needs to change.
The better option is to address the kinds of issues that drive people away before they get out of control. That means putting a top priority on maximizing customer satisfaction – how customers feel throughout the course of their entire journeys with your business.
To do that, you’ll need to perform customer satisfaction measurement using targeted strategies and metrics. Let’s start with some basics.
Customer Satisfaction Involves Every Aspect of Your Business
Customer satisfaction is a very nebulous term. If you’re you’re going to track it, you’ll first need to understand its scope.
A a fundamental level, customer satisfaction is how a buyer feels about their experience with your business. This encompasses their impressions of:
- Your company itself – messaging, values, quality of content, authority
- The buying process – clarity of pricing, ease of purchase, no hidden surprises, quick delivery and/or setup
- The product/service – quality, functionality, ease of use, reliability
- Your customer support – availability, speed of response, helpfulness, professionalism
That’s a lot, and none of this is static. These feelings evolve over time. Your goal is for that evolution to be positive. Developing stronger customer relationships improves retention and lifetime value, and decreases churn. It even brings in new revenue, since highly satisfied customers are more likely to leave positive reviews or advocate to friends.
In other words, once a purchase has been made, your work has just begun. Converted buyers aren’t a successful conquest to be moved on from – they’re now relationships to be nurtured.
Customer satisfaction measurement is essential for finding out how well you’re currently meeting (or hopefully succeeding) customer expectations. To do that, you’ll need to know what metrics to track, how to find them, and how to implement change based upon the results.
3 Key Customer Satisfaction Metrics To Track (And Where To Find Them)
Because it’s so broad, there are many ways to measure customer satisfaction. All of them can be valuable, so where should you start?
Let’s take a look at three of the most important numbers to keep an eye on.
1. Overall Customer Satisfaction Score (CSAT)
Customer satisfaction (CSAT) ratings measure happiness as it relates to a specific touchpoint. It’s a form of direct feedback, since it involves asking the customer to rate an interaction (i.e., on a scale of 1 to 5).
So to gather this metric, you’ll need to send out surveys. Based on the ratings you receive, you can calculate a simple percentage:
CSAT = Total Number of Satisfied Customers / Total Number of Respondents x 100
Naturally, the goal is to get that percentage as high as possible. It’s also important to watch the average over time, keeping an eye out for unexpected drops.
Because this metric is so simple, it’s not used to measure overall satisfaction. If customers rate your entire business (or even a particular product) at 2 out of 5, you’ll have no idea what the problem is. That’s not particularly actionable feedback.
Instead, CSAT ratings are best gathered immediately after a specific interaction. For that reason, they’re typically used to measure customer satisfaction as it relates to customer service. You’ve probably seen plenty of these requests:
“Please rate the quality of the service you received today, on a scale of 1 to 10.”
It’s popular for a reason. This is a good way to gauge the quality and efficiency of your support team, and to find areas in need of improvement.
You can send these surveys out manually, but it’s easier to set up some kind of automation. If you’re using Groove – our customer service helpdesk – you can make this a part of every support interaction.
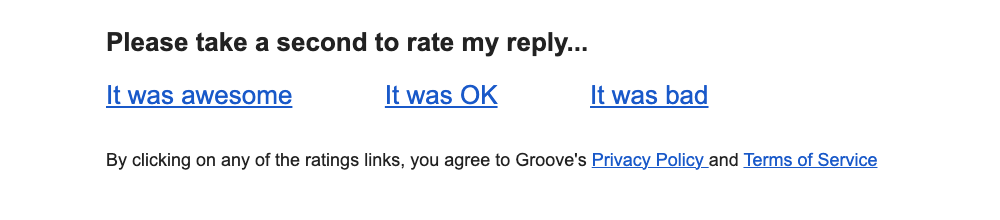
You can customize your CSAT survey and embed it directly into the final email of each conversation with a customer:
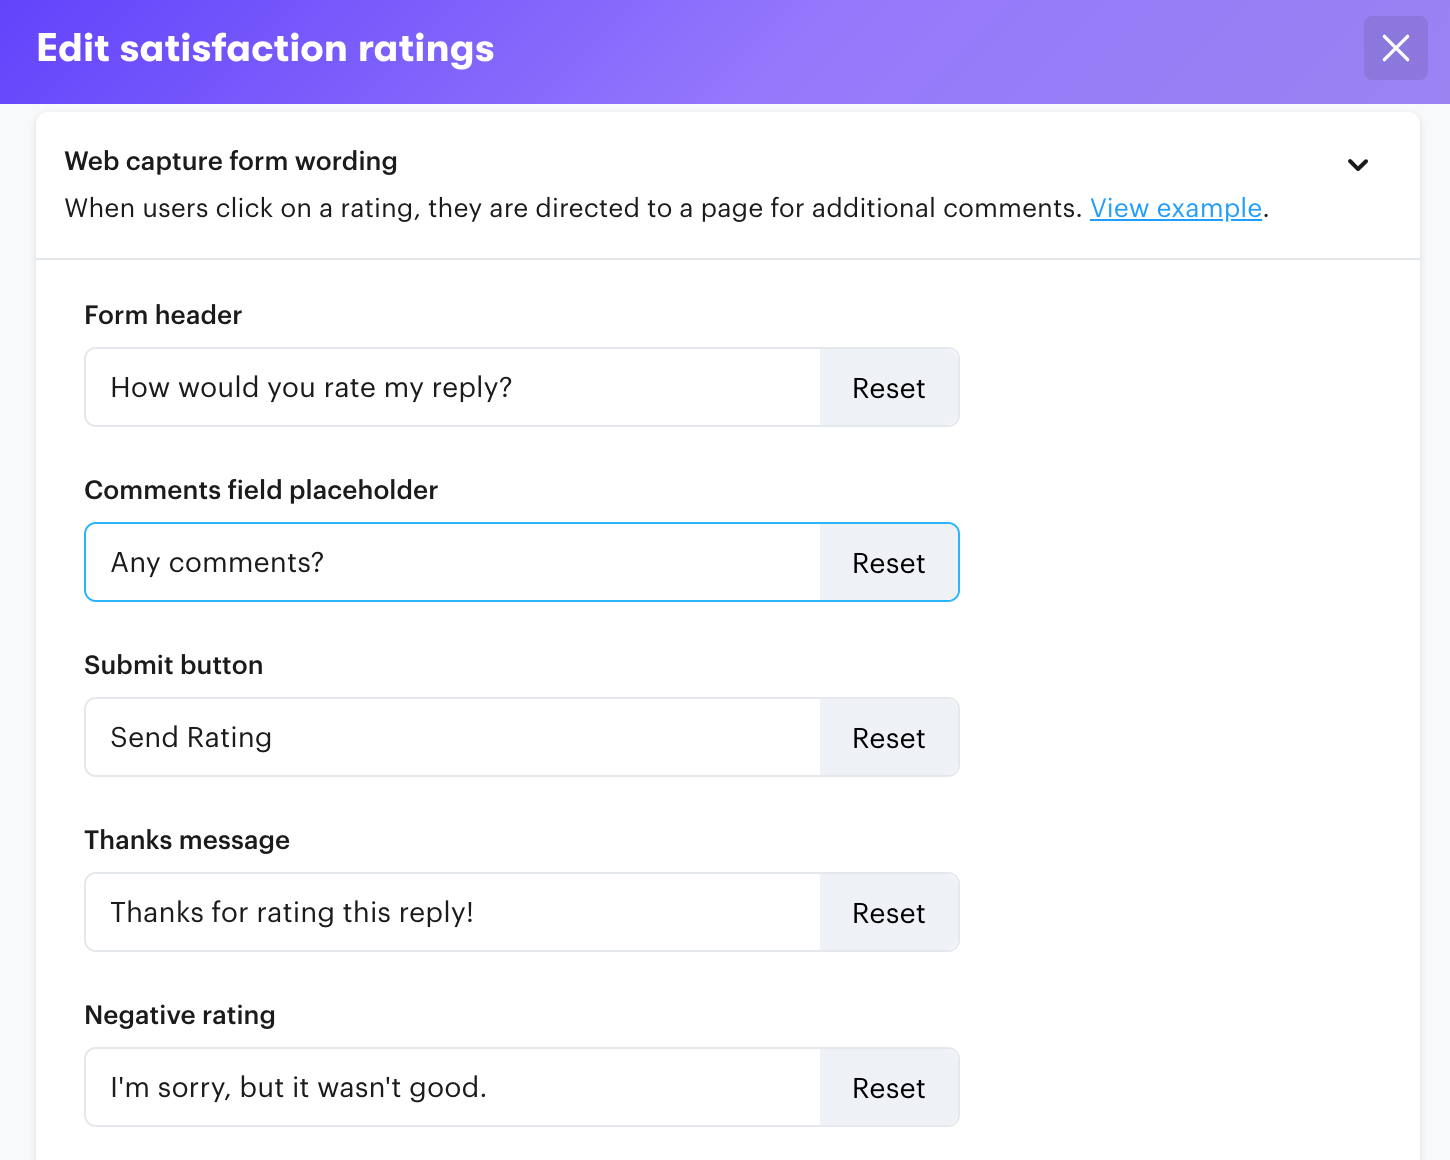
This makes it as simple as possible to gather the information you need. It only take customers a minute to respond, and the resulting data is tracked and averaged automatically.
2. Net Promoter Score (NPS)
Net Promoter Score (NPS) goes a step beyond mere satisfaction to measure loyalty. This score measures how likely customers are to recommend your business to others in their networks.
This is the high-bar test for customer satisfaction measurement. People may stick around and continue subscribing to your service if it’s merely adequate, because finding an alternative takes too much effort. But they’re not going to recommend that service to friends, family, and colleagues unless they’re truly impressed with it.
In other words, NPS tells you if you’re just doing the bare minimum required for retention, or if you’re going above and beyond in a way that fosters organic growth.
Like CSAT, NPS is usually calculated based on the response to a single question. In this case, that question will be something like:
“How likely are you to recommend our product to a friend or colleague?”
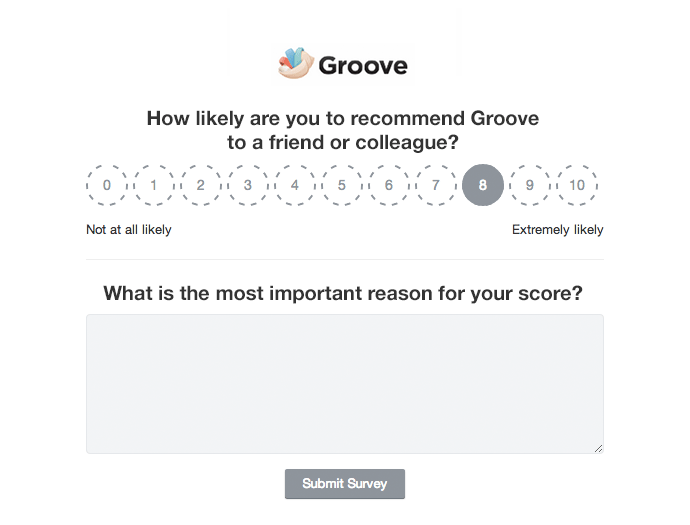
Customers answer this question on a scale. If that scale is 1-10, 10 would represent “extremely likely” and 1 would represent “not at all likely”. Customers are then grouped into categories, via a system like this:
- Ratings from 9-10 indicate Promoters. Loyal customers who will keep doing business with your company and refer others.
- Ratings from 7-8 indicate Passives. Satisfied but not enthusiastic customers who are vulnerable to other businesses vying for their attention.
- Ratings from 1-6 are Detractors. Unhappy (or at least less-than-satisfied) customers who can damage your brand reputation through negative word of mouth.
Finally, you calculate the NPS score via simple subtraction:
NPS = Percentage of Promoters – Percentage of Detractors
The results can be laid out on a -100 to +100 scale:
- -100-0 = Bad
- 0-50 = Good
- 50-70 = Excellent
- 70-100 = Exceptional
Unlike with CSAT, it’s best to send NPS surveys out at pre-determined intervals. If you send this kind of survey to a customer right after a particular interaction (such as a purchase or support exchange), their answer will be heavily influenced by that event.
Sending it out at a set time once every three months makes it more likely that you’ll catch customers in a more ‘normal’ state of use with your product/service. In turn, that makes your NPS score a better overall gauge of satisfaction and loyalty.
So we’d recommend creating a simple NPS survey template email. You can then set reminders to send it out to all active customers a few times per year.
To easily track and follow up on the responses, you can integrate Groove with the Delighted survey platform. For best results, include an open-ended ‘share anything you like’ field along with the primary question, so people can tell you why they are or aren’t likely to recommend your business.
3. Customer Effort Score (CES)
Customer Effort Score (CES) represents how much effort a customer needs to exert to resolve an issue with your product or service. Like CSAT, it’s best used in a targeted way to evaluate a specific interaction or potential pain point.
Let’s say your team recently created a self-service knowledge base where customers can find answers to their own questions, particularly when it comes to troubleshooting technical issues. You want to ensure that this knowledge base is actually being used and reducing ticket volume.
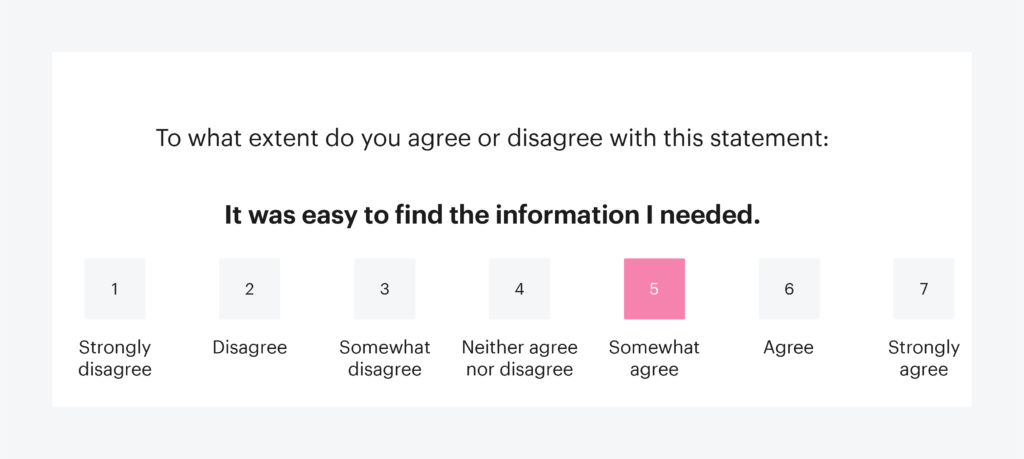
To do that, you might draft a CES survey question like:
“To what extent do you agree or disagree with the following statement: It was easy to find the information I needed.”
You would then add or embed this survey question, along with a corresponding rating scale, at the bottom of each knowledge base article. This is something you can do easily with Groove.
You can track the results to determine overall satisfaction, as well as identify which specific articles need improvement. The overall CES score is calculated as a simple average:
CES = Sum of all individual scores / Number of respondents
CES scores are especially important to measure over time, to ensure that you’re getting an accurate representation of experiences with your brand. For example, customers who took the survey right after a rare website glitch that slowed load times or broke a few pages are going to leave ratings that reflect that temporary issue.
To capture customer effort scores, you can use a platform like Delighted to embed these surveys directly in appropriate touchpoints on your website. For example, you might place one on a post-checkout landing page to rate the purchasing process.
Using Customer Satisfaction Measurement To Set Goals and Improve Performance
Having the data in hand is only half the battle. The real victory comes from using these metrics to improve the customer experience. You’ll want to establish why some customers are happy while others are experiencing friction.
For that reason, understanding the customer journey is important to determining which touchpoints are causing trouble. If you haven’t done so, mapping out the process people follow through their journeys with your business is essential.
Referencing those maps to contextualize your customer satisfaction data helps you figure out where the problems are. It also helps you decide what problems to tackle first.
Not all interactions are equal. Weighing the friction caused against the value of the touchpoint shows where you need to allocate resources to improve the overall CX.
Determining Key Drivers of Customer Satisfaction
What are the key drivers of customer satisfaction for your business?
Chances are that if your customer satisfaction measurements are subpar, it’s a result of one or a few specific failure points. You probably don’t have to overhaul every process – just make careful changes in the right places.
This is a good time to open deeper conversations with your audience. Send out bigger surveys and ask questions on social media. Also, while exploring the data and comparing it with your customer journey maps, don’t forget that points of friction may not be universal.
The factors that determine customer satisfaction measurement (the drivers) often differ across audience segments. Perhaps there are issues with your product’s performance speed, but those issues don’t bother everyone. They’re minor enough that they are frustrating for your younger users, but don’t pose a meaningful barrier to your older users.
In that case, understanding your audience demographics is key. If the majority of your users (or target users) are in that second camp, performance may not be a major driver. You might be better off prioritizing other improvements right now, while reassuring buyers in the minority category that the issue is known and will be taken seriously.
Using Tools To Simplify Workflows and Automate Where Possible
To improve customer satisfaction, you’ll need to make changes that stick. If support response times are low, it’s not enough to just instruct your agents to reply faster. You need to find out what’s slowing them down, and put the process or tools (or both) in place to facilitate real change.
So what’s making it hard for your support team to help customers in a timely manner? Do they lack the necessary knowledge and skills? If so, investing time into training and creating better internal documentation is a great idea.
Are there too many inquiries and not enough time? That calls for automation. With Groove, for example, you can cut out many repetitive customer service tasks by:
- Having messages automatically routed to the right places, and using round-robin assignment to spread work around the team more evenly
- Creating template messages for common use cases, so they can be quickly accessed and personalized
- Leveraging AI features for creating effective responses more quickly
- Offering a high-quality knowledge base so customers can find basic help on their own
Groove also offers a reporting dashboard where you can see your support team’s overall and individual performance:
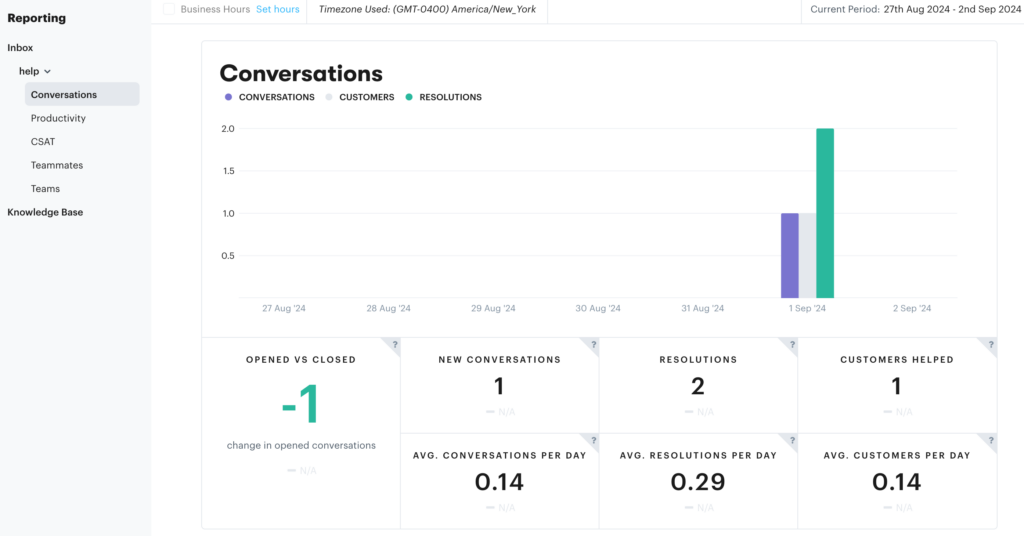
This lets you track key metrics that can be at the root of poor customer satisfaction measurement, like first response time and median resolution time. Customer service isn’t the only factor that influences how people feel about your business, but it has a significant impact. So it’s worth knowing exactly what you’re doing well and what’s pushing those satisfaction scores down.
Improving Customer Satisfaction Requires Proactive Action
Customer satisfaction measurement should be an ongoing process. Even if everything looks great right now, keeping an eye on key metrics is essential. It allows you to be proactive, and identify new issues as early as possible.
For those problems that can’t be prevented upfront, your customer service team is your number-one resource for resolving dissatisfaction. Helping them do that means empowering them with the right training and oversight, as well as providing them with the best tools.
Groove makes delivering a better customer experience (and collecting data from all your customer interactions) a lot easier. Sign up for a free trial today to drive up those customer satisfaction ratings!

