


Struggling to understand why some of your customers stick around for years, but others vanish in the blink of an eye?
Some customers will come and go. Often, business relationships are transitory or temporal, so churn is inevitable. However, it can be minimized, and a high churn rate often signals something wrong that requires immediate action.
Performing a customer churn analysis helps you develop a better retention strategy, and address shortfalls or friction in the customer journey. Let’s talk about why that is, then we’ll offer some tips for getting started.
When Is Customer Churn Analysis Necessary?
Customer ‘churn’ measures the amount of buyers who stop doing business with your company. While conversion rates tell you how successful you are at getting people to make an initial purchase, churn rates let you know how many stick around.
Churn is a useful metric for any business. However, it’s especially vital for small SaaS companies and others that rely on ongoing subscriptions. You earn more from regular income via current customers than from brand-new purchasers. When your customers downgrade their plans or allow renewals to lapse, your bottom line takes a hit.
In other words, if you depend on a high retention rate, churn matters immensely. Keeping customers satisfied costs a lot less than finding new ones.
It’s a good idea to conduct customer churn analysis regularly, such as every month or at least every quarter. This lets you see whether your churn rate is increasing or decreasing.
You can also perform targeted analysis when you suspect an issue. If you see a sudden decline in sales, for example, churn rate indicates whether those lost sales are mostly from new or existing customers.
Churn Rate: Knowing What’s Normal and What Signals a Problem
How do you know if you have a churn problem? The rate you aim for will depend on your niche and other unique factors. So it’s smart to do some research into what level of customer loss is normal in your industry.
For small but well-established SaaS businesses, a good benchmark is a maximum of 5-7% for annual churn, or 1-3% for monthly churn. If your business is newer, you can be more forgiving. You might aim for annual churn to be no higher than 10-15%, and monthly churn no higher than 3-5%.
Specific numbers aside, what’s most important is to keep an eye on your churn rate over time. Exactly where the rate is at right now matters less than where it’s going. If you have a fairly high churn rate but you’re seeing it decrease quarter-by-quarter, you know you’re taking the right actions.
How To Conduct a Customer Churn Analysis (In 4 Steps)
Before you can perform your first customer churn analysis, you’ll need to ask the following question:
When should your business consider a customer churned?
Like pretty much all metrics, ‘churn’ has no single definition. You’ll need to define what it means for your business. That could be customers who buy a single product and never return, cancellations, failures to renew annual plans, or even downgrades to cheaper tiers.
While you can track more than one of these, we’d suggest starting with the type of churn that’s most relevant to your current goals. With a specific target in mind, you’ll be ready to dive into our four-step customer churn analysis process.
Step 1: Set Up the Tools You’ll Need
Unless your customers number in the dozens, tracking churn manually is a time-consuming prospect. To save time, improve accuracy, and reduce human error, you’ll need at least one tool for measuring churn.
Fortunately, there are plenty of great resources out there to help you collect data and analyze it. What you opt for depends on your goals, budget, and experience. Here are a few suggestions to get you started.
Analytics Dashboards
To start your customer churn analysis, you’ll need a tool that can track churn rate, along with other key metrics. There are many fancy and expensive platforms for this purpose, but you can do a lot with a simpler and more streamlined solution.
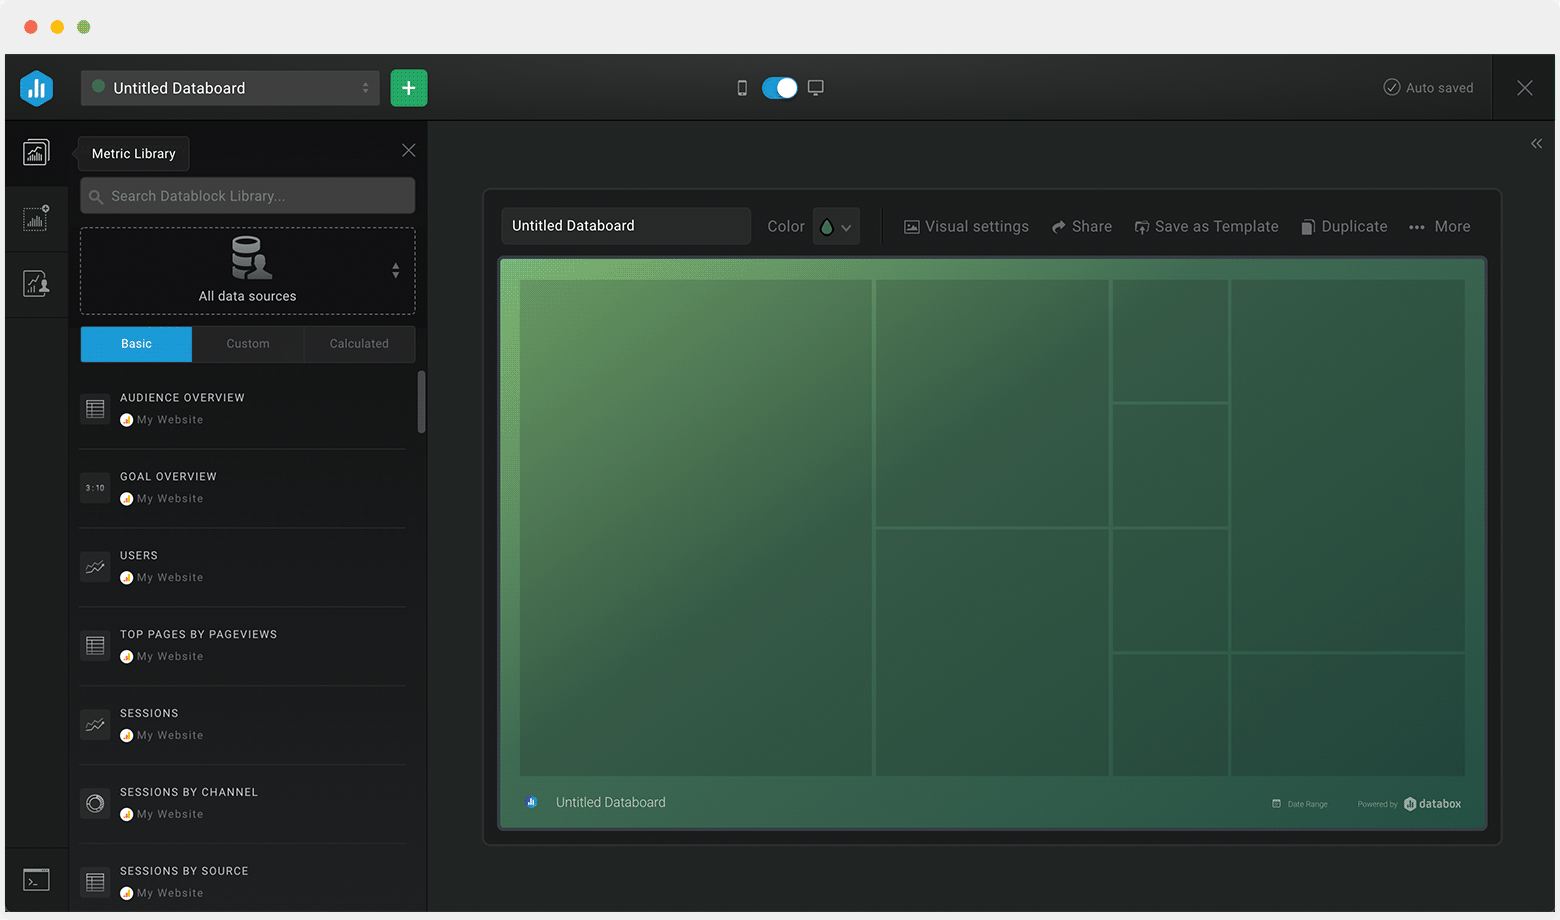
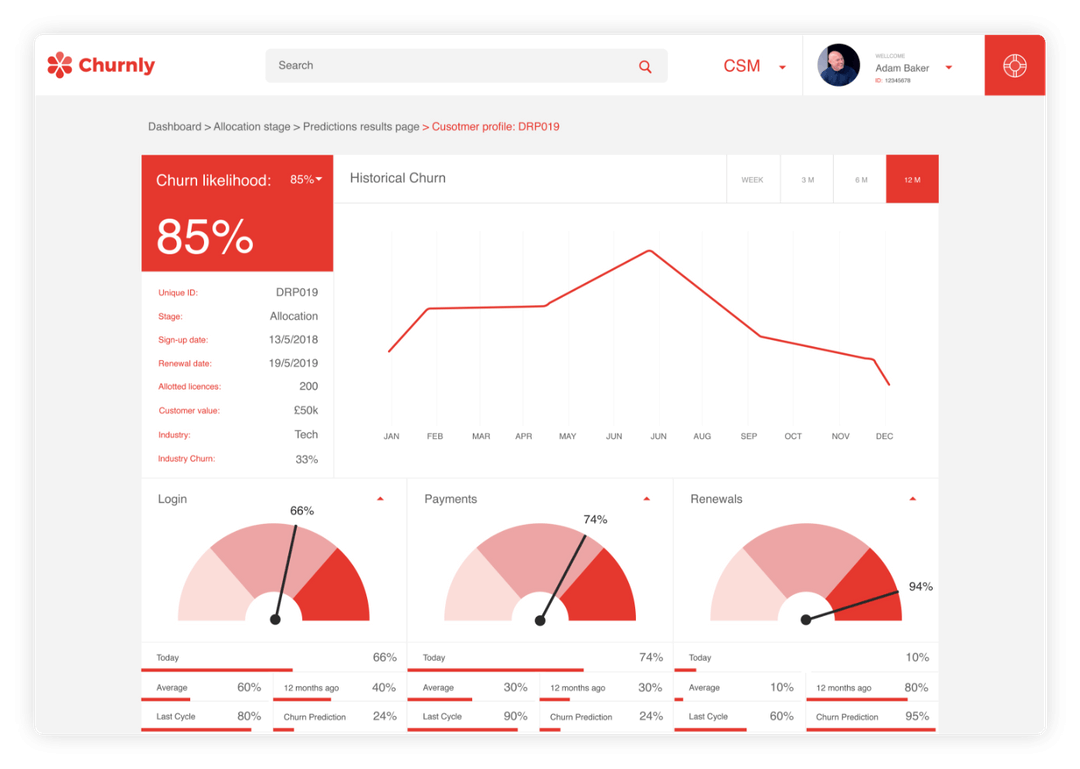
Tools like Databox and Churnly offer free plans, and can help you map out why customers are leaving. They let you see the effectiveness of your retention strategies in real time.
Databox, for example, allows you to track key KPIs and analyze churn on a granular level. Its pre-designed dashboards don’t require any coding knowledge to set up and monitor.
Churnly, on the other hand, uses predictive AI to determine which people are most likely to leave at each stage of the customer journey. Through identifying actions that may signal a customer is about to churn, you learn where and when to take action.
Behavior and Survey Tracking Tools
It’s not enough to simply measure your churn rate. In order to assess it in context, you’ll need more information about your customers.
A high churn rate can indicate many potential problems. Narrowing them down requires having data about your audience’s demographics, actions, support history, and so on. And you’ll need to start tracking that data before you can perform a customer churn analysis.
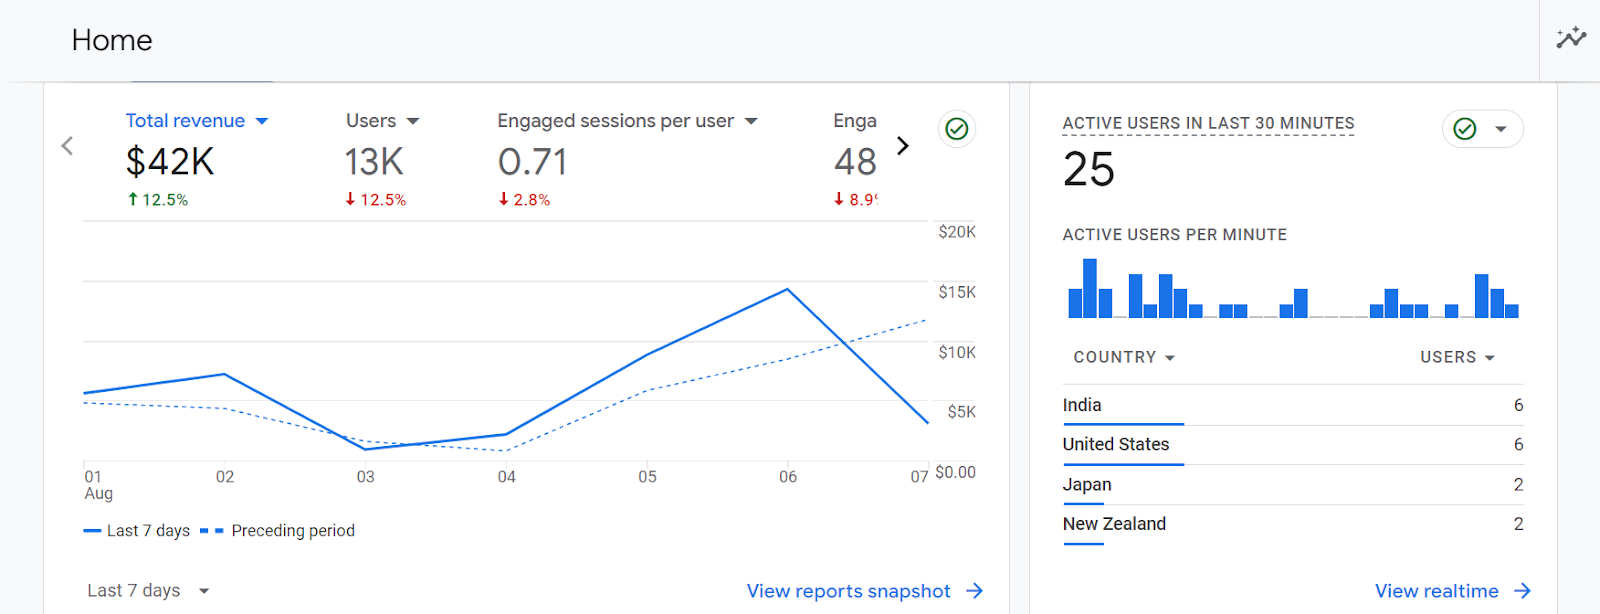
Once again, you don’t have to break the bank to get what you’ll need. Google Analytics is a great place to start:
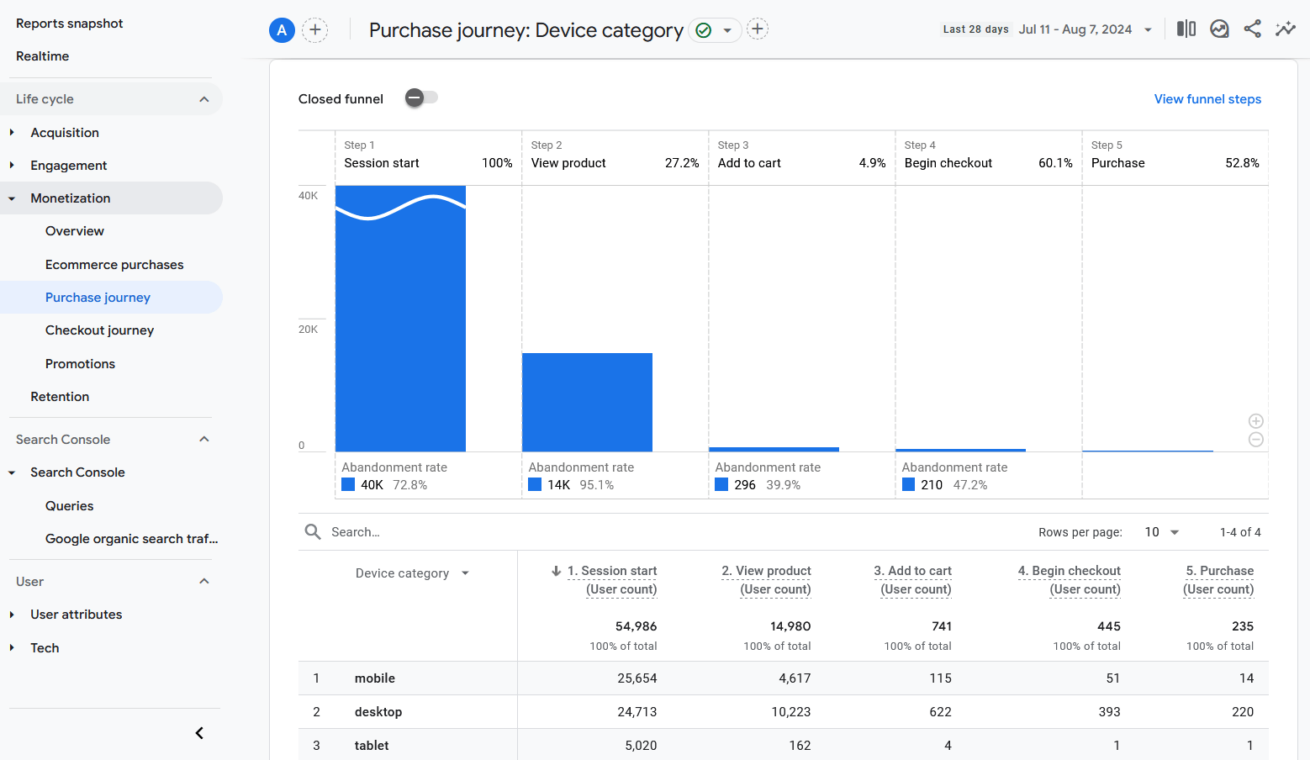
Google’s analytics platform is free, and can be customized to track whatever data you’re most interested in. You can differentiate between user segments, track behavior across platforms, and visualize metrics via graphs and charts:
Gathering details about your customers is great. But don’t forget to listen to what they have to say! Direct customer feedback is immensely valuable in telling you what customers do/don’t like, how they interact with your offerings, and where their pain points are.
For that, you can check out our customer service helpdesk, Groove. Not only does it make customer support easier and more effective – it helps you make sense of your churn rate, too.
The quality of your customer service plays a huge role in retention. If customers are churning, Groove can show you what impact your post-purchase support is having:

You can view conversations between support agents and customers, explore performance metrics, and even ask customers directly about their experiences. Best of all, Groove is very easy to set up and start using, and we offer affordable plans designed for the needs of small online businesses.
Step 2: Define Your Churn Rate
Once your tools are in place, the real work of customer churn analysis begins. That starts with calculating your current churn rate.
After all, you need to assess where you’re at before you can determine how to improve. Defining your initial churn rate also gives you a baseline metric you can compare future calculations against.
We already talked about deciding what defines ‘churn’ for your business. You’ll also need to choose a set time frame to work with. You can evaluate this metric on an annual, monthly, weekly, or even daily basis.
In a general sense, the larger your business is and the more customers you have, the shorter your analysis period should be. However, what’s most important is to keep it consistent, so you can accurately track the churn rate over time.
Let’s assume that most of your customers are on month-to-month subscription plans. In that scenario, it makes sense to measure churn monthly.
To define your churn rate, calculate the percentage of customers who have stopped using your product over the previous month, as follows:
Customer Churn Rate Formula
Y/X multiplied by 100 = Z
Y = The number of customers lost during the past month
X = The number of customers at the start of that same month
Z = Your customer churn rate as a percentage
For example, maybe you want to measure the customer churn rate for December, which has been a problematic month due to a poorly-received update. At the beginning of the month, you had 150 customers. By the end, you had 130 left, meaning that you lost a net 20 users.
If you divide 20 by 150, and multiply that by 100, you get 13.33. In other words, your monthly churn rate for December was about 13%.
Alternative Churn Metrics
That’s the simplest way to measure churn. But there are variations you might also want to consider calculating as part of your customer churn analysis.
While the basic churn rate gives you a percentage of customers lost, it can’t tell you how that affected your bottom line. Not every customer brings in the same revenue. So it’s useful to know whether you’re losing high-value or low-value buyers, which you can assess as follows:
Gross Revenue Churn Rate Formula
X/Y multiplied by 100 = Z
X = Churned revenue during a set time period
Y = Monthly recurring revenue in the same time period
Z = Your gross revenue churn rate percentage
Although there are plenty of others, the last metric we’ll touch on here is the adjusted churn rate. As your business grows, you may experience an increase in total customers along with significant churn during the same time period.
If you have a net total increase of customers, calculating based on lost customers alone can be misleading. To get a more comprehensive view of churn, you can use this approach:
Adjusted Churn Rate Formula
( Y / [ ( W + X ) / 2 ] ) x 100 = Z
W = The number of customers at the start of the period
X = The number of customers at the end of the period
Y = The number of churned customers during the period
Z = Your adjusted churn rate percentage
By accounting for an additional variable, adjusted churn rate offers a more precise look at how your customer acquisition and retention are interacting.
Step 3: Analyze the Data and Determine Why Customers Are Leaving
Once you’ve calculated your churn rate(s), it’s time to identify the specific customers who have left. You may not be able to (or need to) find all of them, but a decent sample will let you dig into why they’re churning.
That means diving into customer data through purchase histories, subscription records, customer profiles, survey results, and more. This is the point at which any data you’ve gathered about demographics, behaviors, etc. will be very helpful.

The first thing you’re looking for during customer churn analysis is the reason each buyer left. Then you can identify the primary patterns that emerge. Was it a lack of customer support? Poor updates? Insufficient onboarding?
When you find common threads, dig deeper. For instance, let’s say that 40% of churned customers left due to a specific software update. That’s a great start, but it doesn’t give you the exact problem.
After all, not everyone left. So there may be segments of your customer base that weren’t served by this update. Did it remove a feature they were using, or add complexity that hampered their workflows?
If you can’t determine these reasons with the data you have, you can dig into demographics and behavioral metrics for clues. You’ll learn a lot by comparing the customers who did and didn’t leave.
Do most of those who churned after the update run businesses with five or fewer employees, while those running larger companies stuck around? Are people on one subscription plan more likely to churn than those on lower or higher tiers?
Surveying Customers for Firsthand Insights
Of course, you can only learn so much from data points. If your analysis leaves you with questions, you can ask those questions directly.
Now that you know which customers are churning, consider sending out surveys. You can target buyers who’ve already left, as well as those who remain but have characteristics that put them at high risk.
Customer Satisfaction (CSAT) ratings are very helpful here. Effective customer satisfaction surveys keep fluff to a minimum, and ask direct questions either in the form of multiple choice or open-ended questions.

We’d recommend a mix of both for your customer churn analysis. Open-ended responses in particular help identify root causes of churn that are hard to see with just numbers.
Using Testing and Experimentation To Assess Churn
Along with gathering data and asking for customer feedback, you can also perform testing. When the issues behind churn are especially unclear, a few targeted experiments can help narrow things down.
What this looks like will vary wildly, so let’s explore an example. You’ve reviewed the data and sent out some surveys, and it’s become clear that customers often leave due to usability issues. They’re struggling to use your product effectively, but you’re still not sure why.
In that case, you can conduct a thorough usability test. This means testing a website, software, or application to see if people can (and do) use it as intended. It shows how your product performs through the eyes of a user, and illuminates potential friction/pain points.
To get started with usability testing, you might:
- Begin with a hypothesis. Perhaps you suspect your churn problems are due to a confusing user interface – people can’t find the options they need, or have trouble understanding what each menu item does.
- Establish the outcomes that will validate your hypothesis. What results do you need to see to feel confident that you understand the problem?
- Recruit real users who are unfamiliar with your product. If they represent part of your target audience, even better. You might reach out to leads who haven’t converted yet, and offer a small reward or free trial period as incentive.
- Put your hypothesis to the test. Have your recruits walk through common use cases, and observe the results. What’s easy for them? What do they find difficult or frustrating? What do they not seem to understand without further explanation?
- Conduct interviews and document your findings. Get users’ feedback, and ask targeted (but not leading) questions based on your hypothesis.
At the end of this process, you should have a much clearer understanding of what’s turning some customers away. All that’s left is to use that knowledge to improve your business.
Step 4: Implement Proactive Strategies To Reduce Churn
Once you’ve identified which customers are churning and why, it’s time to start fixing the problems. You can’t eliminate churn entirely, but you can prevent and reduce much of it.
If your customer churn analysis revealed that there are indeed usability issues with your product, there are multiple routes you might take. Perhaps all you need is more documentation and tool-tipping, or a clearer onboarding process. Alternatively, you may need to tweak your product’s interface with real customer use cases in mind.
You can also use the results of your analysis to provide extra support to customers who are at high risk of churning. For example, you might create rules that trigger emails or reminders to check in with customers who are showing specific warning signs.

With Groove, you can even trigger emails based on the frequency of feature use. When a customer isn’t using a feature that buyers who churn often underutilize, you could guide them towards key resources (a demo, tutorial, personalized onboarding, or self-service page).
Other effective retention strategies can include bolstering customer support and providing white-glove onboarding for new features. You can even adjust your marketing campaigns to bring in more customers who aren’t likely to churn – especially if your analysis suggests that the problem isn’t what you’re offering, but that you’re attracting the wrong audience.
Whatever changes you make, it’s vital to monitor them. This means continuing to track your churn rate, as well as the other data and indicators we’ve discussed. If you’re careful to make a single change at a time, the results can tell you a lot about whether it’s having an impact on retention (and if not, why).
Understand Why Your Customers Leave, Then Encourage Them To Stay
Customer churn analysis gives you a lot more control over your retention strategies. If you can understand why people stop doing business with your company, you’re on the right path to keeping them around for longer.
This process is complex, but it’s much easier with the right tools. Groove helps you connect directly with your customers, collaborate on conversations with them, and even gather data about their experiences. It’s a vital tool for finding out how customers – both the happy and the unhappy ones – engage with your business.
That’s just the start! Groove is simple to use, yet enhances all aspects of your customer support strategy. Check out the free trial, and find out how it can help your small business grow.
